
Because mPace keeps all the round time data in one place, it can show how round times trend over months.
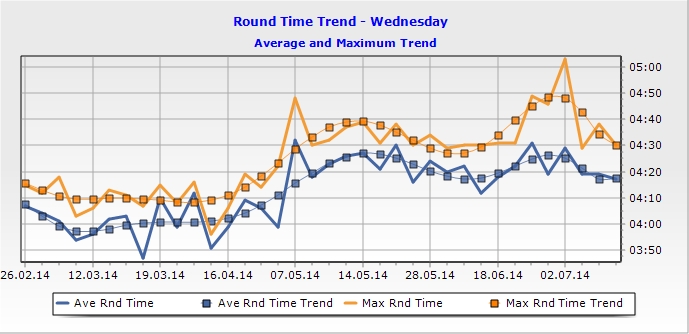
The trend above shows the trend for each teeblock on each day going back 6 months. It is possible to show longer trends using a preference setting.
The early round times on the graph show a very acceptable trend. The average round times are below 4:10 while the average maximum round times (no matter where they were in the field) are only just above 4:10.
The second half of the trend shows an increase in the round times to 4:25 and 4:35. It helps to understand that this period corresponded to a new stage in the course development opening and a lowered expectation of round time was experienced for a short period. Once notifications started going out, this trend again dropped to something more acceptable.
Leave a Reply